

Use the menu item "Tools > Lottery Number Oracle..."
Select the lottery you want to analyze.
Select the number you want to analyze. You can analyze any number from the current number pool. If the lottery you chose has bonus ball(s), then these numbers will appear at the bottom of the dropdown menu.
This dropdown menu is active only for "pick type" lotteries. For these lotteries, select the number position. Positioning is reckoned from left-to-right, so choosing "3" from a Pick 4 type lottery will analyze the third number from the left.
If checked, the analysis will list every instance of where the number you are analyzing has appeared.
Clicking this button starts the analysis process.
If checked, the analysis will list every instance of where the number you are analyzing has appeared.
Clicking this button starts the analysis process.
Clicking this button copies the Analysis results to the System Clipboard.
Clicking this button saves the Analysis results to a text file.
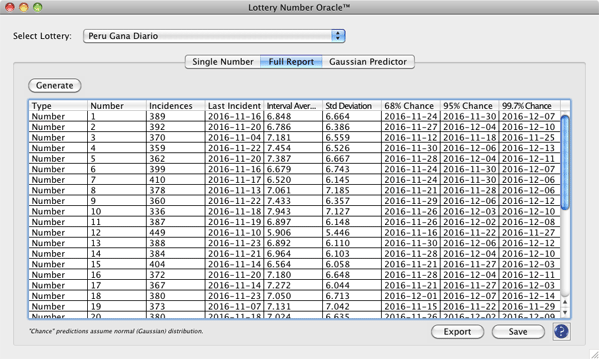
Clicking this button starts the report generation process.
This list box shows the content of the entire report. You can resize columns by dragging the header borders. You can also sort any column by clicking on the column's header. Subsequent clicking alternates between ascending and descending order.
Here is a description of each column:
*assuming normal distribution
Clicking this button exports the report as a Microsoft Excel file.
Clicking this button exports the report as a Microsoft Excel file.
The Gaussian Predictor mode show the predicted (by-date) values for the numbers in the lottery. Values shown are sorted so that the earliest dates appear at the top of the report. You can select the sigma value and, if applicable, which numbers to display. For example, if your lottery has a bonus number, drawn from a separate pool, you can select the main (non-bonus) numbers or the bonus numbers. If your lottery is a "pick-type" lottery, you can select which number position to analyze.
Choose between 1 sigma or 3 sigma. 1 sigma show the predicted by-date values based on 1 standard deviation (68%); 2 sigma shows values based on 2 standard deviations (95%); and 3 sigma shows values based on 3 standard deviations (99.7%).
If your lottery has a bonus number, drawn from a separate pool, you can select the main (non-bonus) numbers or the bonus numbers. If your lottery is a "pick-type" lottery, you can select which number position to analyze.
Clicking this button starts the report generation process.
This list box shows analysis results. You can resize columns by dragging the header borders.
Here is a description of each column:
Clicking this button exports the report as a Microsoft Excel file.
Clicking this button exports the report as a Microsoft Excel file.